Johannes Köppern
Dr. Johannes Köppern
Data Scientist
„I’m a data scientist with experience leading teams across multiple industries and a strong scientific as well as technical background.“
Contact Me
E-Mail: info@johanneskoeppern.com
Telefon: +49 171 3196222
Make an Appointment for a Call: Link
LinkedIn:
Link
My posts
- Add notes to logbook via PC, smartphone or voice recording (Medium, GitHub)
- From Data to Action: A Data Scientist’s Journey in Creating a User-Friendly Web App for Real-World Problem Solvin (Medium, GitHub)
- Get GPT to Output JSON Consistently
- Demystifying Multivariable Polynomial Regression: A Hands-On Approach to Fitting Data with Linear Regression and Python
- PhD website
- LangChain: A Quick Look at Its Core Functions
- Two Minds (GPT-4 and me), One Script: Our Brief Python Adventure for image croping
- Custom Question-Answering (QA) Bot: Transforming PDF Interactions with LangChain and ChromaDB (Medium)
- Self-Consistency with Chain of Thought (CoT-SC) (Medium)
- Iterative Prompt Crafting with ChatGPT: A Step-by-Step Guide
Projects
Solving an Accuracy Issue
Summary: A newly developed Dispendix product performed outside the acceptable accuracy range. I clarified the cause of the problem based on data from a measurement campaign carried out for this purpose and developed a solution. With its implementation, the aforementioned product is sold to customers.
Task: A product did not meet the quality requirements of the customers, the sale was stopped. The details of the problem were initially unclear and so my task was to clarify it, solve it, accompany the implementation of my solution in the product and then train my colleagues in the use of my solution.
Approach: Build up domain knowledge, design measurement campaign and closely accompany its implementation, visualise and evaluate measurement data, understand the cause on the basis of the data and my technical system understanding and think up solution options, present and develop solution after decision with the overall technical management, accompany implementation of the solution in Scrum team, develop and provide cloud tools necessary for the application of my solution for the lab, agile development to deal with the ambiguities, lead the team in software development and in the lab respectively. Outcome: My solution was integrated into the software of the product and the new procedure was documented for the laboratory and the customer respectively. I brought my solution to my colleagues in the lab and briefed them on my new approach. The product with mysolution meets the quality requirements of the customer and can be sold. Used tools: Pandas, Numpy, Scipy, Seaborn, sklearn, SciPy and TensorFlow, among others.
For my task, I worked as a data scientist, control engineer, with comprehensive understanding of the measurement systems in the lab and together with my colleagues in software development and in the lab. I approached and solved the task holistically with domain knowledge, my understanding of data and how to generate it, as a communicator and technical leader in agile Scrum teams. My task was to find out the cause of the poor accuracy of one variant of the Dispendix dispending product and to solve this problem. I therefore developed a comprehensive measurement protocol through which I collected – with colleagues in the lab – a lot of data on said accuracy. With this data, which I visualised suitably for myself and for the decision-making level, I understood the the nature and extent of the problem under consideration, identified its physical root cause, devised options for solving it and evaluated them with a simulation. I did this in Python based on my domain knowledge and calibrated it with the measurement data obtained so far. My solution approaches worked in simulation, I presented them to the decision makers and we then implemented one variant of my solution in the product. To do this, I specified the software to be developed and accompanied the in-house software developers during the implementation in an agile Scrum process. Afterwards, I had the lab test the new software, again in a Scrum project, and thus proved its success. The product could now be sold on the market.
I recognised the cause of the problem and how the product’s controller has to be adjusted on the basis of the data recorded and the data analysis I carried out: to address the issue, the product’s software must take another state variable into account. And to make this state variable available to the product’s controller/software I designed a suitable estimator. With my solution, the product now always performs within the permissible accuracy range.
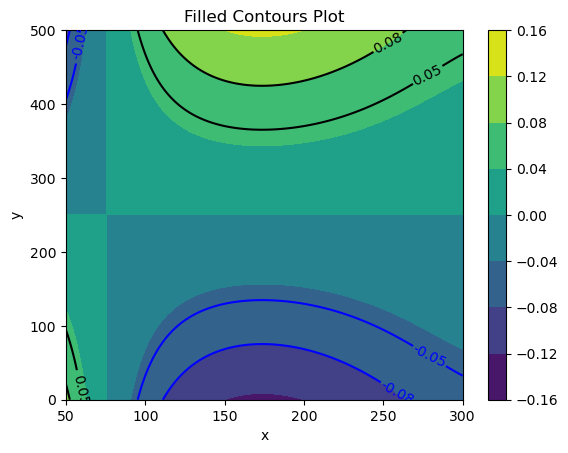
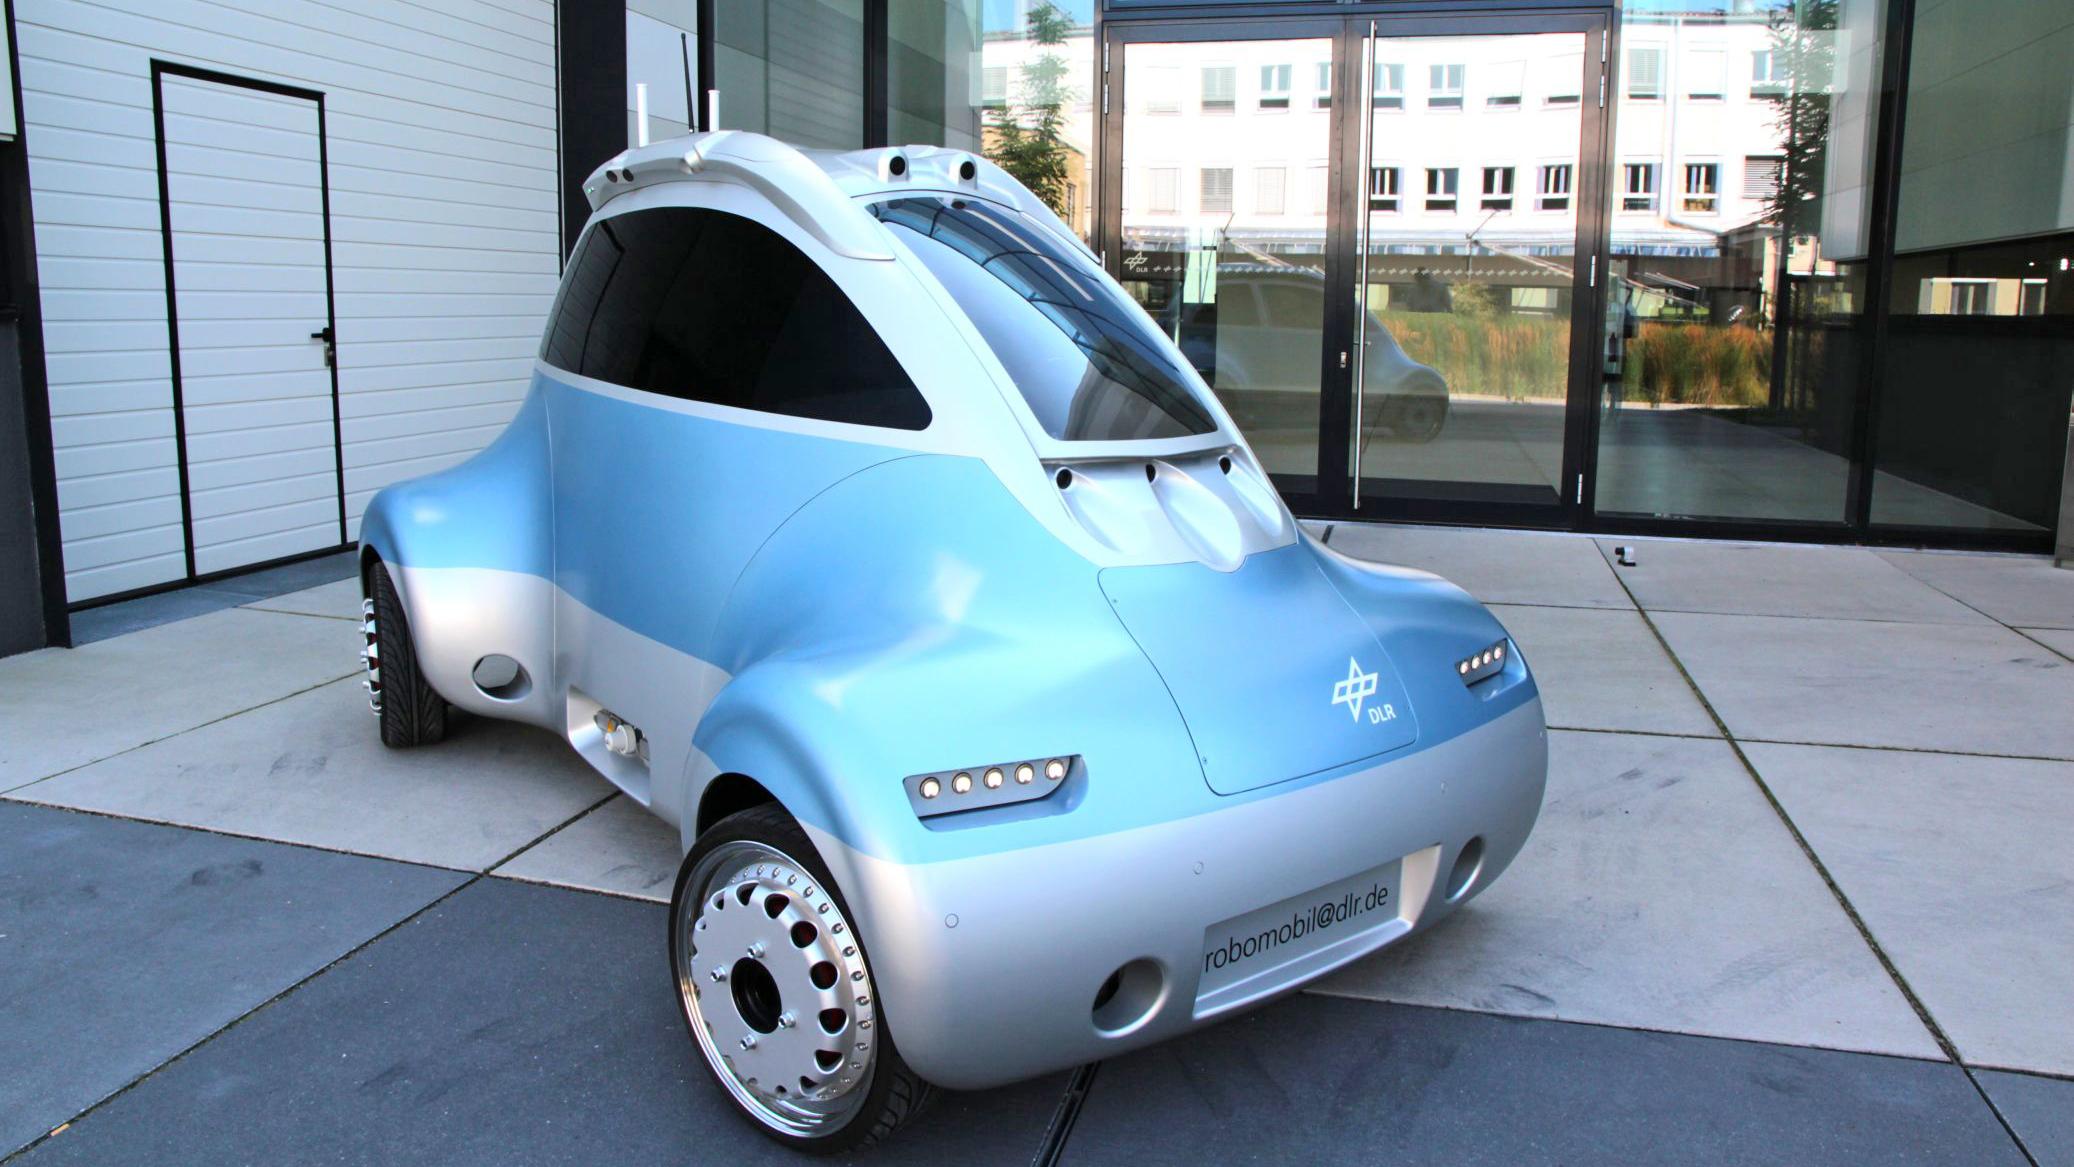
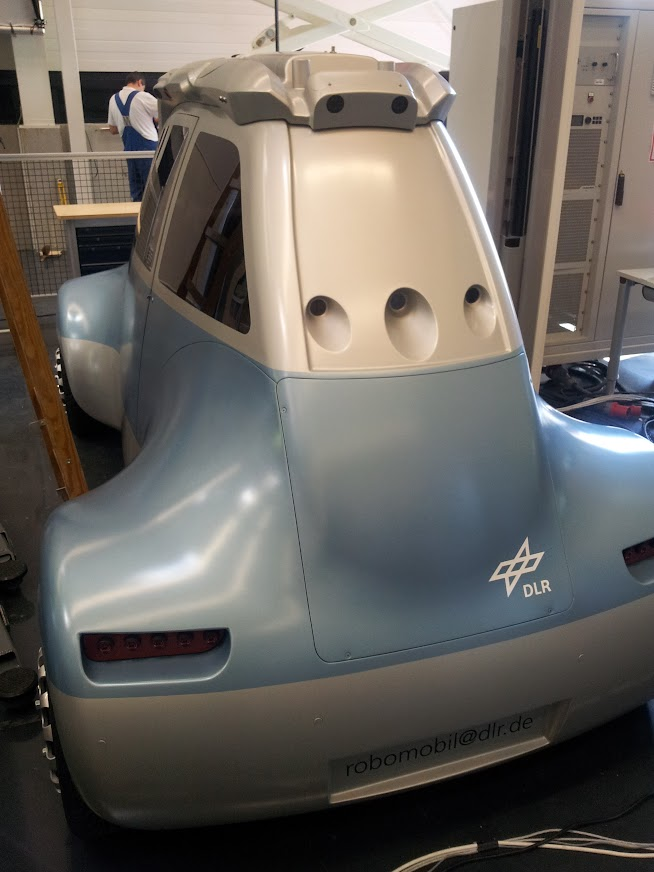
Worst-Case analysis as stability assessment
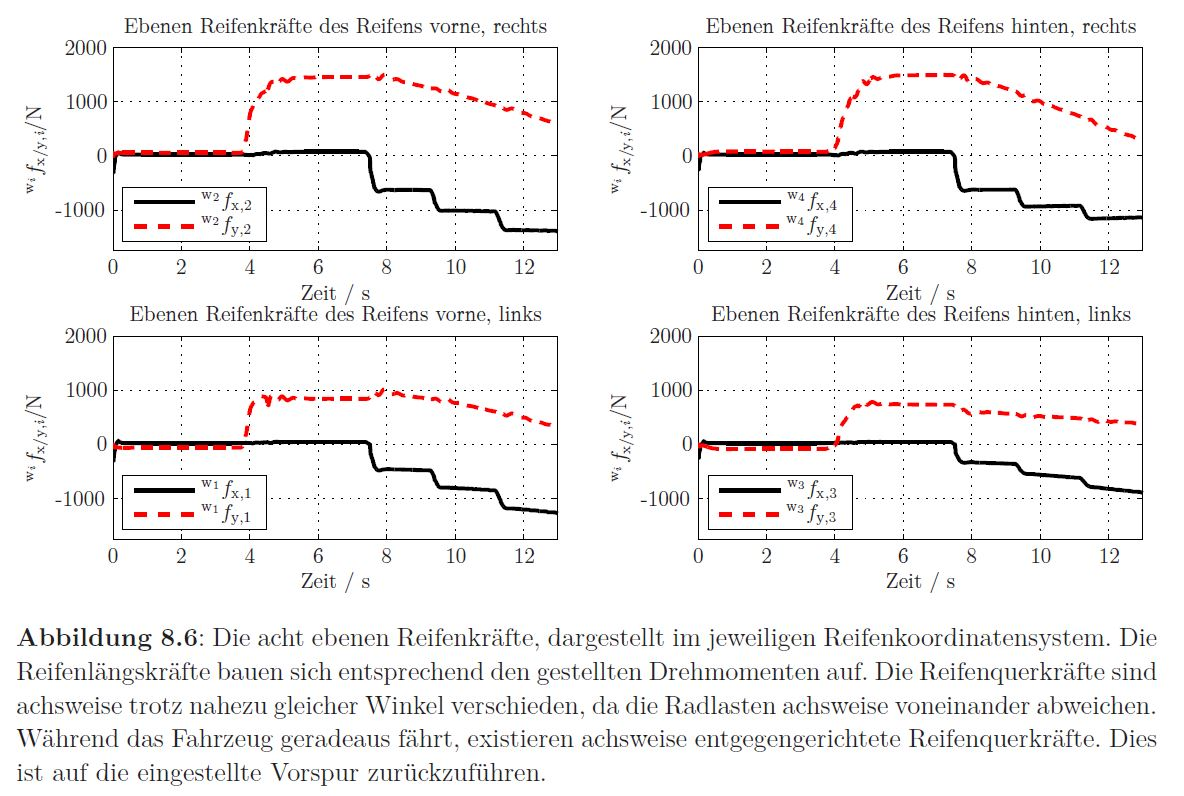
Summary: It was to investigate whether my developed vehicle dynamics control system can stabilize the vehicle’s ride even under changed environmental conditions.
Task: Evaluate how safely my developed vehicle dynamics control system stabilises the vehicle even under changed conditions. For example, can the vehicle follow a curve precisely on icy roads – is the controller robust?
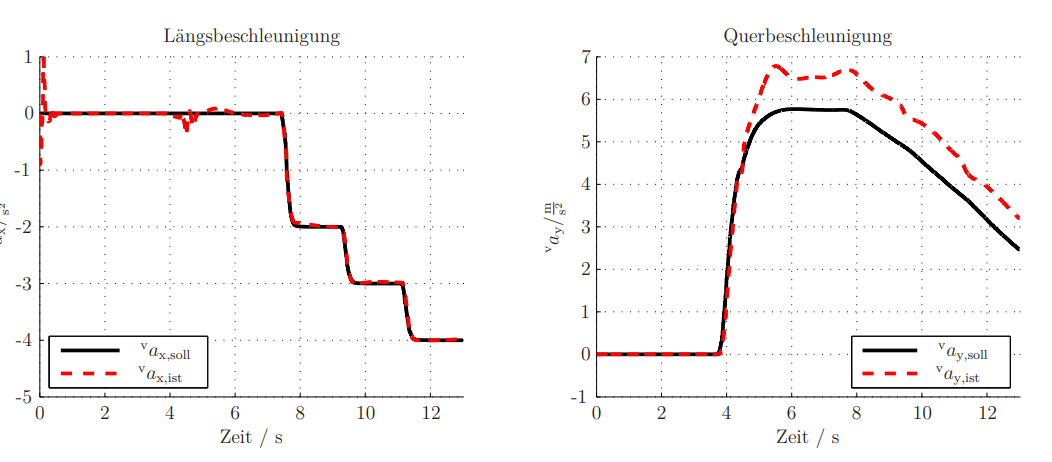
Left figure: Longitudinal acceleration, which is gradually reduced, i.e. the brakes are gradually increased. Right figure: Transverse acceleration, which is built up on entering the curve and reduced with decreasing speed (due to braking in the longitudinal direction) for a constant curve radius. Overall, the default (black) is implemented sufficiently „well“ even in the worst case, see red lines.
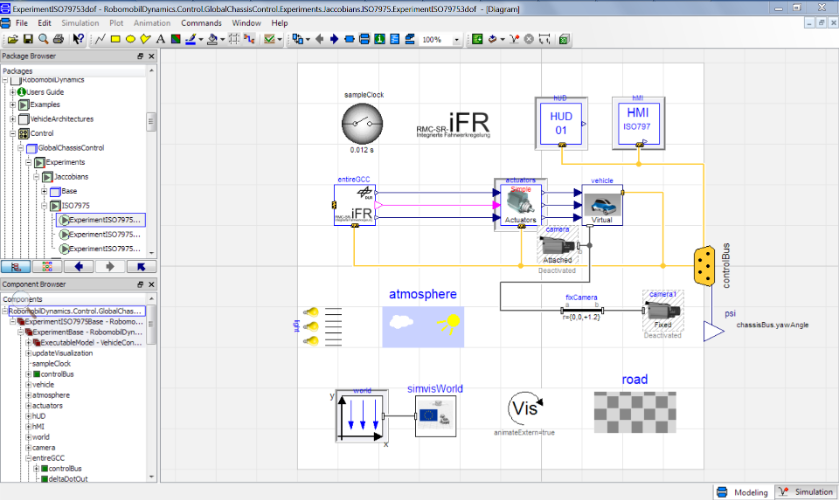
Approach: Closed-loop simulation of my controller and a multi-body model of the vehicle, standardized motion demand „Breaking in curve“, definition of a scalar criterion to evaluate the quality of the implementation of the movement requirement, definition of parameters that can vary in reality (such as the vehicle mass or the mentioned friction coefficients between the tires and the road), optimization-supported choice of these parameters so that the movement requirement is implemented in the worst possible way, then assessment of whether this bad“ case is still „good enough
Outcome: This „robustness analysis“ shows that the designed control system lets the vehicle implement the motion request „well“ enough for at least one maneuver, even under selected changed initial conditions. The assumed robustness is therefore not falsified, robustness may be assumed.
Used tools: Modelica/Dymola, non-linear optimization (SQP/MOPS)
To prove that my vehicle dynamics control system stabilises, as I developed it at the German Aerospace Center, the car in every possible situation, a worst-case analysis is carried out by me as a data science project. I quantified the stability to be investigated, selected parameters, such as the speed of the vehicle or the coefficients of friction between tyre and road, that affect the stability of the control loop and determined through optimisation the parameter combination that leads to the lowest stability reserve. In this way, I was able to prove, based on optimisation and simulation, that my controller still stabilises the driving manoeuvre under consideration even in the worst case.
For this work I used tools like Modelica/Dynmola, Matlab/Simulink and DLR MOPS.
Details can be found in my dissertation, which is also on my website about my work at DLR and my doctorate.
I would also be happy to tell you more about this in a telephone conversation – please make an appointment with me for this at https://johannesphd.de/calendly.htm.
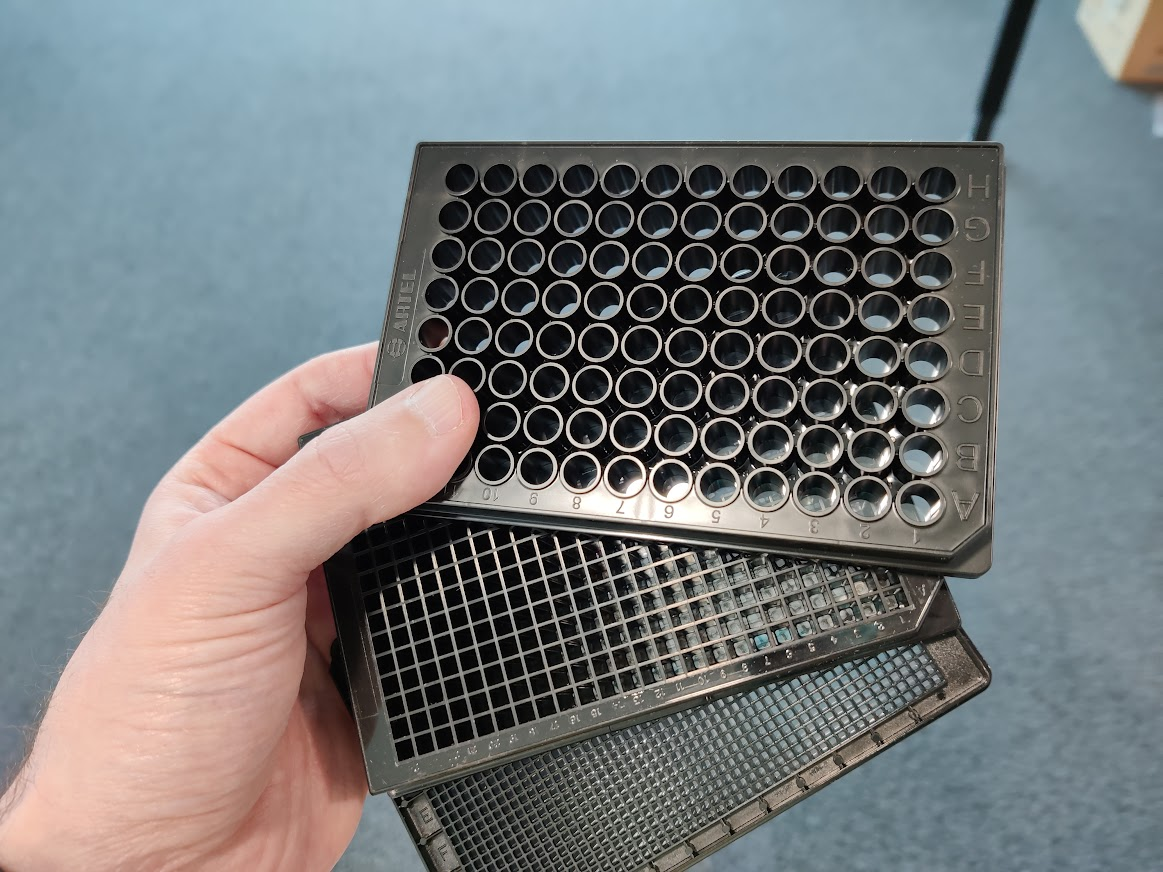
Fill-Level Estimator
Summary: In the ongoing operation of my controller in the Dispendix product, it requires knowledge of the fill level. Since this is not measured, I developed an approach to reconstruct it from existing measured variables.
Task:The fill level of the handeled liquid has an influence on the function of the dispendix product and this is compensated by my controller and therefore this fill level must be available to my controller. It is still not measured directly and no additional sensor should be installed for this purpose. Thus, it was my task to determine this fill level from existing measured variables, such as an internal pressure signal with the available data resources.
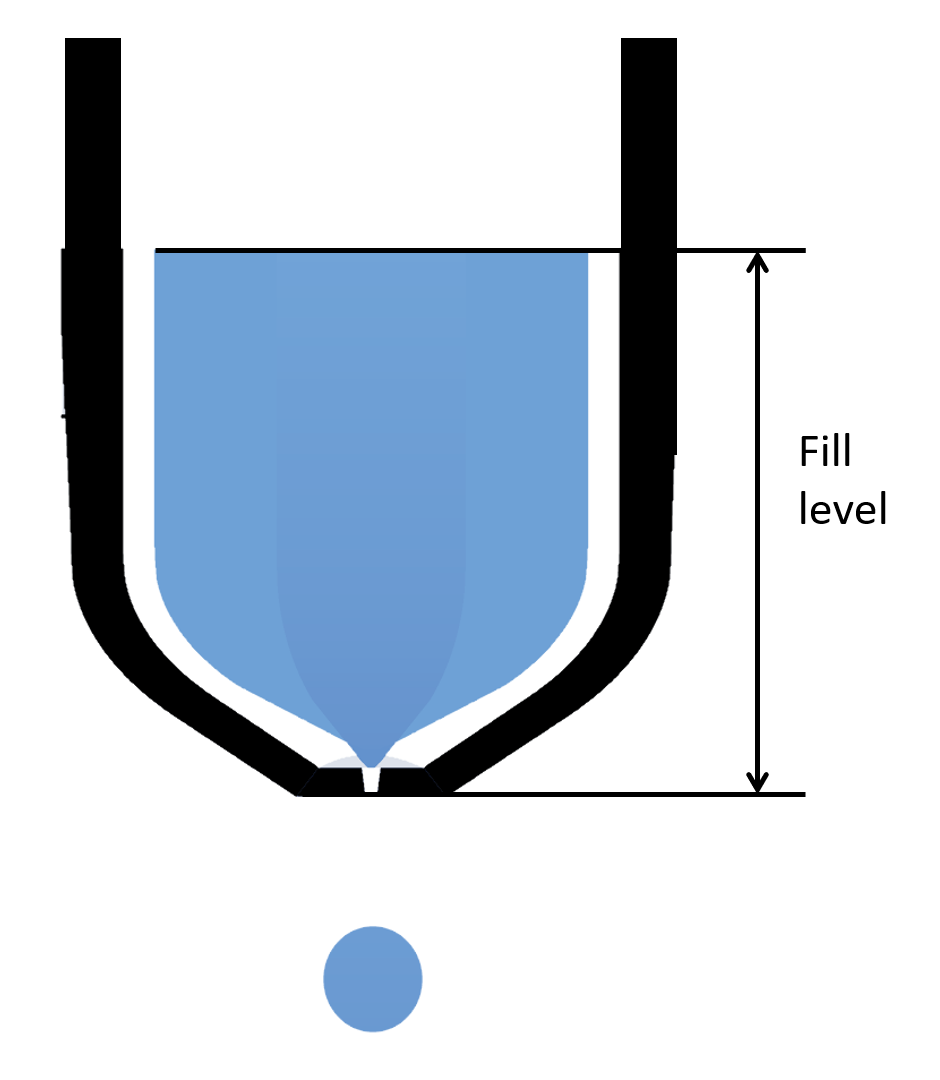
Approach: Recording of fill levels and available sensor quantities, feature engineering based on domain knowledge (which I built up with simulation in this area), identification of a suitable measurand for the task using analysis of correlation/mutual information, identification of a polynomial by which the quantity sought can be determined from the sensor signal, evaluation of the model
Outcome: The filling level can be reconstructed (estimated) from the existing measured variables with my invention. My control approach can thus be used without further hardware.
Used tools: OpenFOAM, Pandas, Numpy
The dispendix products drain liquid from so-called wells. The fill level of the respective wells is relevant for several reasons, but it cannot be measured directly by the unit. Therefore, I devised an (estimation) approach to reconstruct this level from existing measured variables. I implemented my concept in software and then tested it by simulation. I was able to implement this on the basis of the measurement data I had collected for another reason and thus prove the functionality of my estimator even before it was implemented in the product.
I was able to make this invention on the one hand with my basic physical knowledge, my domain knowledge about the product under consideration and on the other hand with data analysis and visualisation results (which allowed even deeper understanding to emerge in me). And on this basis, after coming up with the idea, I did the feature engineering I thought of, was able to implement the first prototype of the estimator in Python and evaluate its accuracy in an automated way with all the available measurement data.
In order to dispense a drop of the liquid in the well, the dispense device builds up an overpressure above the liquid in the well by opening a valve. The time course of the resulting pressure pulse is measured by a pressure sensor. This measurement is made in order to regulate the integral of the pressure over time according to the specification and because of this regulation, the said pressure integral also always corresponds to the specification.
I realised that the height and the width of the pressure impulse change with the change of the filling level in the well and I determined both values as so-called features. Now I exponentiated these variables and the set pressure integral sufficiently often, also defined these powers as features and identified a polynomial of corresponding degree by means of linear regression through the measuring points and the actual filling level recorded for the training of my approach. This polynomial represents the estimator described here. I determined the degree of the polynomial, which I called sufficiently high, in such a way that the polynomial describes the relationship between the features and the dependent variable „level“ well („good“ shall not be defined further here) without an over-fitting.
This idea has already been published and I can therefore describe it here.
Covid19 data collection and visualization
Summary: As part of
a private project, I began collecting COVID19 data from the RKI website in
March 2020 and analyzing it according to my research question as a lay
epidemiologist.
Task: My goal was, first, to extract information from the RKI data on new SARS2 infections that I did not obtain from media coverage, such as the pattern of daily new infections by day of the week. On the other hand, I wanted to learn web scraping (at the beginning of the pandemic, the data was only available to me on an RKI page and not accessible via an API.) in Python, the necessary handling of my Raspberry Pi, processing of the collected data and its visualization, respectively to use my skills in this area.
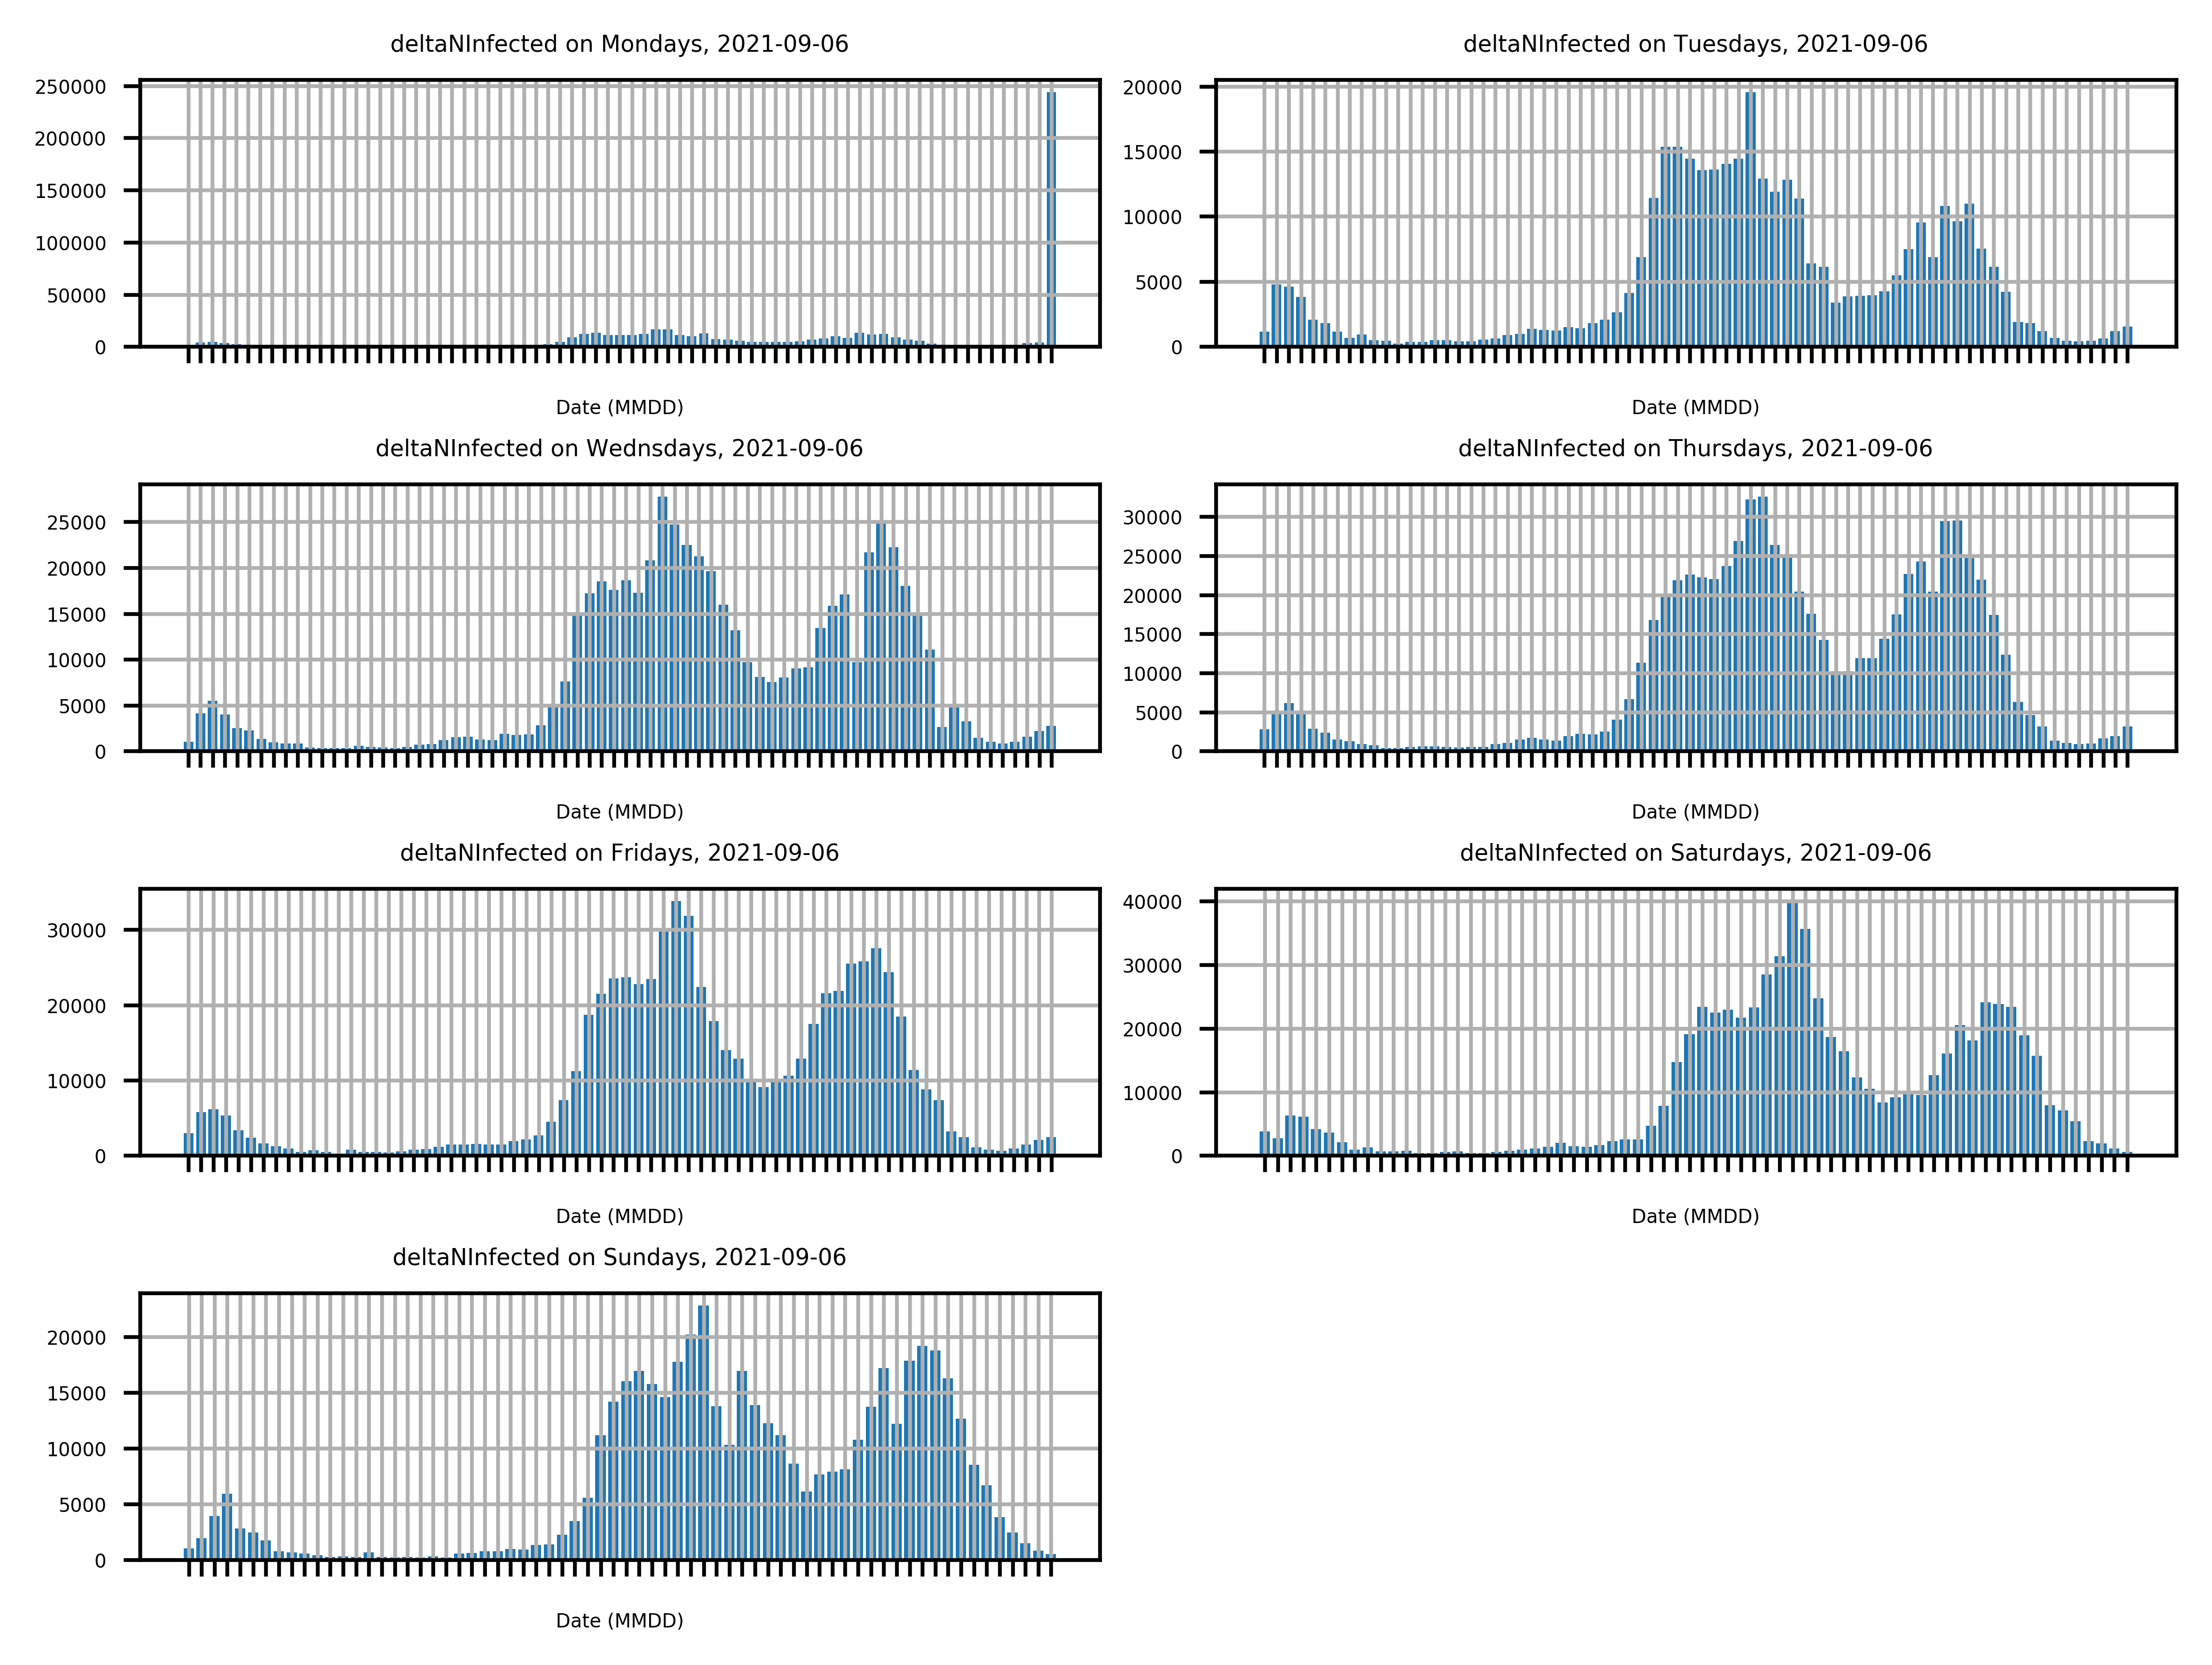
Approach: A Raspberry Pi retrieves an RKI HTML page daily, extracts the number of new infections for the day from it, writes it to a CSV file, performs analyses with this data, visualizes the results, and updates a website I hosted with a web hoster. Said CSV file is located in a Git repository that is automatically committed and pushed to an external server.
Outcome: The information I was looking for is generated daily and made available via an HTML page on the Internet. Further I expanded my skills in the fields of web scraping, data analysis and HTML programming.
Used tools: Pandas, Linux, Selenium, Matplotlib, pysftp, HTML
Domain Knowledge
Through my broad interest and ability to learn new things quickly, I built up or deepened domain knowledge based on my solid fundamental education:
- Control engineering (linear and non-linear)
- Simulation: Multi-body model (MBS) and fluid simulation (CFD)
- Vehicle dynamics control
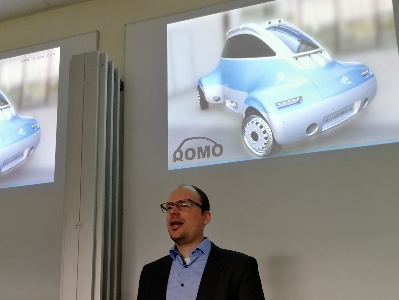
- Development of an electric vehicle
- Deep knowledge of engineering fundamentals, engineering mechanics, fluid mechanics, mathematics
- Software development
- Business management basics
- Medical technology and its approval/cost absorption
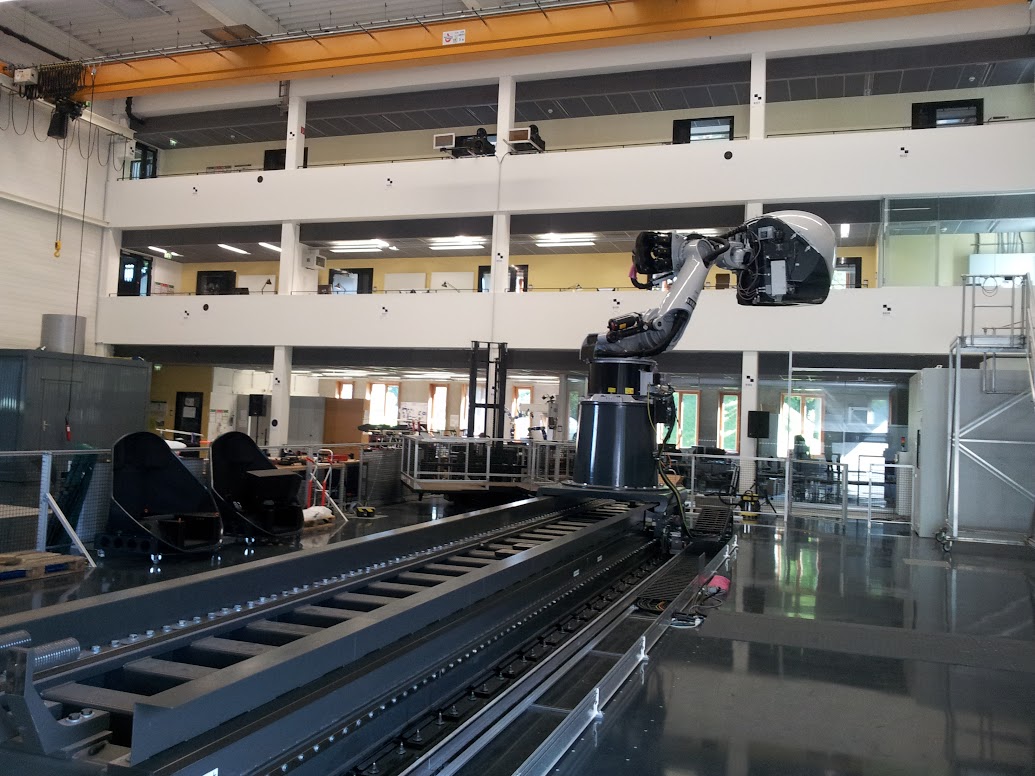
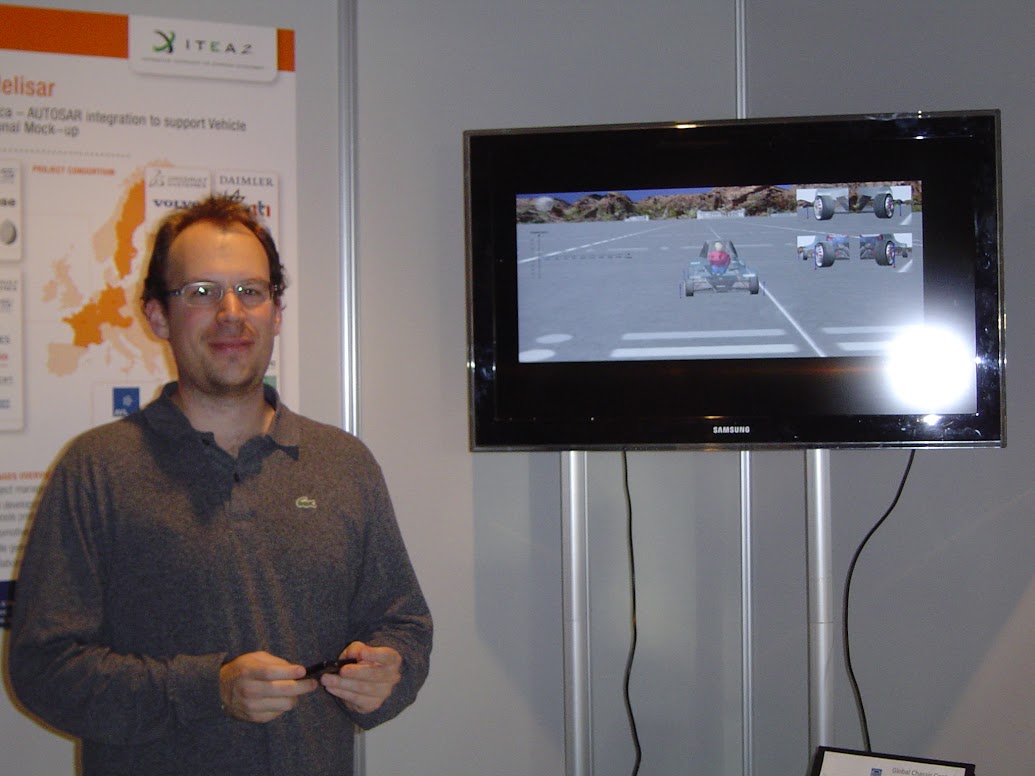
Photos


Contact Me
E-Mail: info@johanneskoeppern.com
Telefon: +49 171 3196222
Make an Appointment for a Call: Link
LinkedIn:
Link